- Home
- Documentation
- Community
- Projects
- Boards
- Agilex 5 SoC
- Agilex 7 SoC
- Arria 10 SoC
- Nallatech 385A - Arria 10 FPGA Network Accelerator Card
- Nallatech 385A-SoC Accelerator Card with Arria 10 FPGA
- ALARIC Instant DevKit ARRIA 10 SoC FMC IDK by REFLEX CES
- Altera Arria 10 SoC Virtual Platform
- Altera Arria 10 SoC Board
- Nallatech 510T compute acceleration card with Intel Arria 10 FPGA
- REFLEX CES Achilles Arria 10 SoC SOM
- Terasic Arria10 SoC Board : HAN Pilot Platform
- Arria V SoC
- Cyclone V SoC
- Altera Cyclone V SoC Board
- Arrow SoCKit User Manual - July 2017 Edition
- Arrow SoCKit User Manual - November 2019 Edition
- Arrow SoCKit Evaluation Board
- Atlas-SoC Development Platform
- Critical Link MitySOM-5CSx Development Kit
- Cyclone V Ethernet driver problems
- DE10-Nano Development Board
- Terasic DE10-Standard Development Kit
- Devboards DBM-SoC1 module
- Devboards DBM-SoC2 module
- EBV SoCrates Evaluation Board
- Enclustra Mercury SA1 SoC Module
- Enterpoint Drigmorn 5
- Enterpoint Larg 2
- Altera Cyclone V SoC Development Platform
- Mpression Helio SoC Evaluation Kit by Macnica
- Mpression Sodia Evaluation Board by Macnica
- ARIES Embedded - MCV System on Module
- Mpression Borax SOM Module and Development Kit by Macnica
- Enterpoint Mulldonoch 3
- Networked Pro-Audio FPGA SoC Development Kit by Coveloz
- NOVPEK™CVLite
- NOVSOM®CV
- NOVSOM®CVLite
- NovTech IoT Octopus™
- NovTech NetLeap™
- Enterpoint Raggedstone 4
- Solectrix SMARC compliant System-on-Module
- Terasic DE1-SoC Development and Education Board
- Stratix 10 SoC
- Find a Board
- News
Documentation
Similar topics
-
 Linux Application Debugging With DS5
Debug Linux applications over Ethernet using ARM DS 5 Intel SoC FPGA Edition
 -
Create SD Image 17.1 GHRD with Kernel socfpga-4.9.78-ltsi and Angstrom 2017.06
Process of creating how sdimage for 17.1 GHRD and Linux socfpga 4.9.78 ltsi
Recent Changes
-
 Macnica Sulfur ~ Development Kit for Agilex™ 5 FPGA E-Series ~
-
 Building Bootloader for Agilex 5
Building latest bootloaders for Agilex 5 SoC Devices
 - Ashling RiscFree Examples
-
 GSRD for Agilex 7 I-Series Transceiver-SoC DevKit (4x F-Tile)
Golden System Reference Design for DK SI AGI027FB, DK SI AGI027FA and DK SI AGI027FC
 -
Intel® Simics® Simulator for Intel FPGAs Release Notes
This page provides release information about the Intel® Simics® simulator for Intel FPGAs.
Table of Contents
Debug Linux kernel and drivers over JTAG using ARM DS-5 Intel SoC FPGA Edition
Debug Linux kernel and drivers over JTAG using ARM DS-5 Intel SoC FPGA Edition
Introduction
This page presents an example of using ARM DS-5 Intel SoC FPGA Edition to debug Linux kernel and drivers.Prerequisites
The following were used to create this example:- Host computer running Ubuntu 14.04LTS - other versions may work too
- SoC EDS Pro Edition v18.1 - for the ARM DS-5 SoC FPGA Edition
- S10 SoC Development Kit with:
- OOBE HPS Daughter Card
- QSPI SDM Flash Card
Configure Linux
In order to perform Linux kernel debugging, the following are required:- Linux running on your target board
- Availability of Linux kernel ELF (vmlinux) on your host computer
- Availability of Linux kernel source code on your host computer
- /home/radu/linux-socfpga/vmlinux - kernel ELF
- /home/radu/linux-socfpga/ - kernel source code
Debug Kernel
1. Start an Embedded Command shell:~/intelFPGA_pro/18.1/embedded/embedded_command_shell.sh2. Start ARM DS-5 Eclipse:
eclipse &3. Go to Run > Debug Configurations… 4. In the Debug Configurations dialog, right-click DS-5 Debugger on the left panel and select New. 5. In the Debug Configurations dialog, perform the following:
- Rename the configuration to DebugKernel using the Name edit box
- Select the Target to be Intel > Stratix 10 > Linux Kernel Debug > Debug Cortex-A43x4 SMP
- Select Target Connection to be Intel FPGA Download Cable
- Click the Browse button near the Connection edit box and select the desired FPGA download cable instance
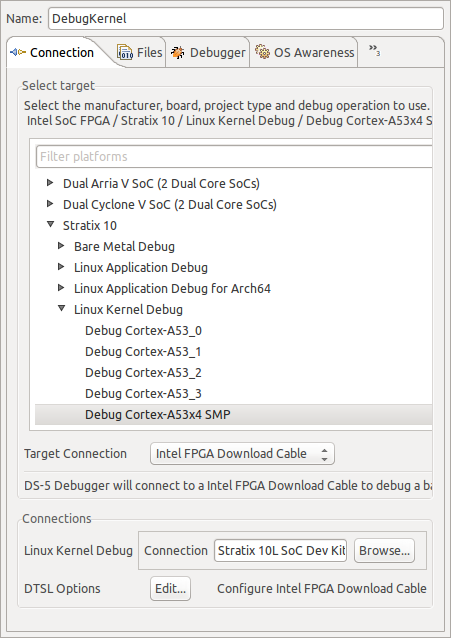
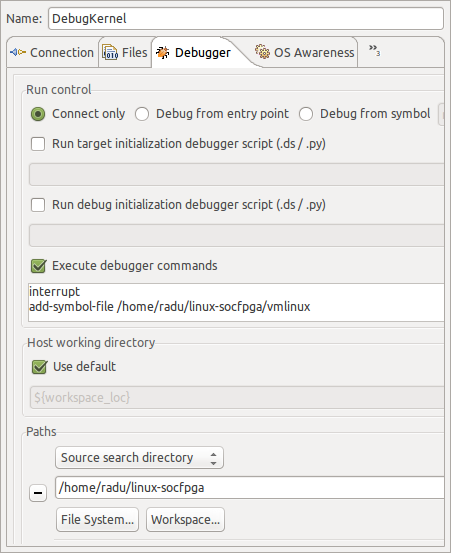
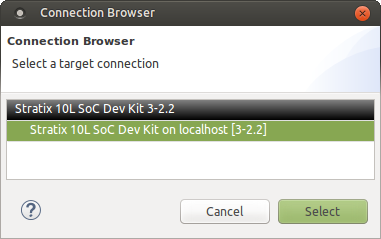 5. Click on the Debugger and perform the following steps:
 - Select option Connect Only for Run Control
- Check Execute debugger commands check box
- Add the debugger commands to stop cores and load image symbols for the Linux executable, as shown below
- Add the path to the Linux source files on the host machine to allow the debugger to locate them
 6. Click the Debug button. The debugger connects to the board, stops the cores as instructed and loads the kernel symbols. It determines where the cores are stopped, and highlights it in the source code. The following figure shows the debugger stopped in the idle instruction.
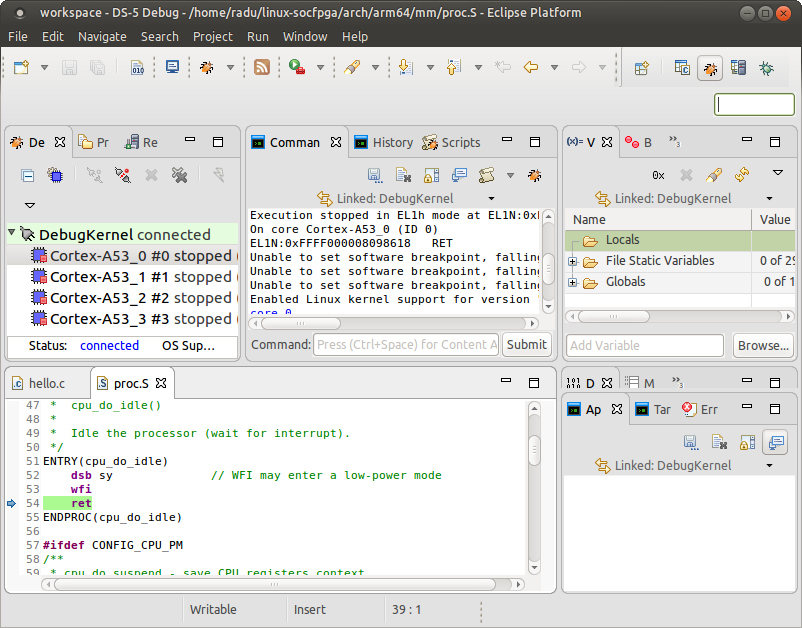 7. By default, the cores are shown in the top left panel.
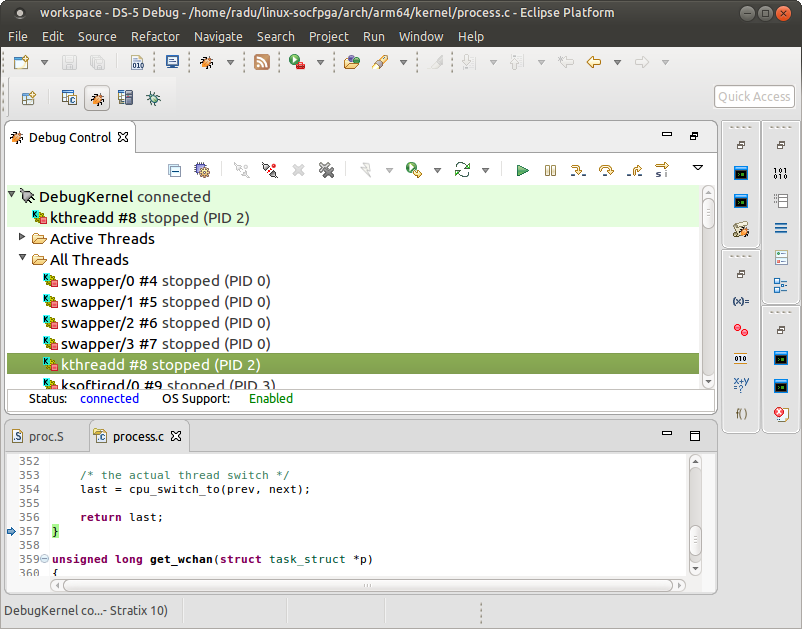
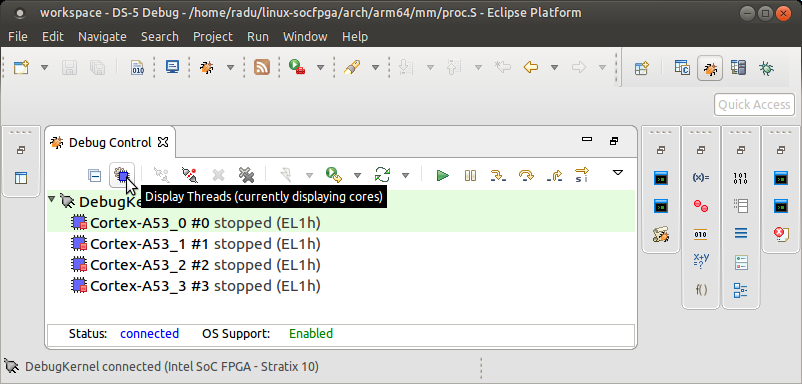 8. Click the button shown above to switch to displaying the threads instead.
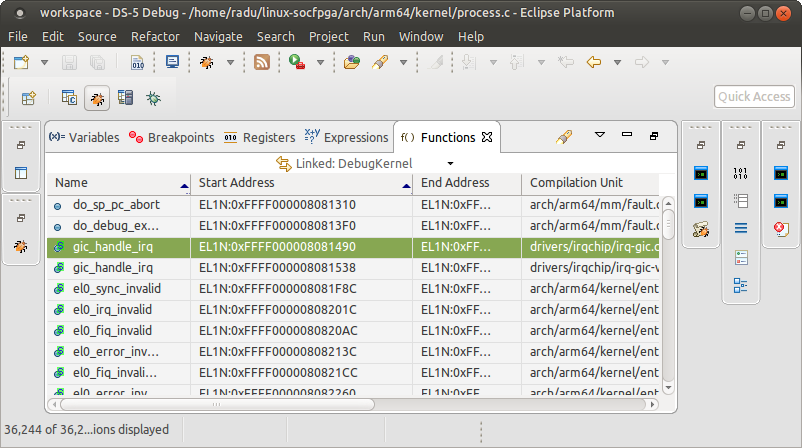
 9. Minimize the Debug Control panel and maximize the Functions panel from top right. All of the functions in the kernel are displayed. The Functions panel supports the following operations for each function:
 - Run up to the function
- Set PC to function
- Locate in source code, memory, or disassembly
- Set breakpoints to software or hardware
- Set trace points to enable, disable, or toggle
 10. Use the regular debug features, such as breakpoints, stepping through code, viewing variables, looking at registers, etc.
Trace Kernel
ARM DS-5 supports PTM and STM tracing, and it allows different tracing output options. This section presents an example of Program Tracing using PTM and storing the tracing information in memory using ETF. The tracing scenario presented here uses Linux kernel debugging as an example, but any application can be traced in the same way. As shown, the tracing can be selected to show current core, a particular core, or follow the currently executing thread. The following steps are necessary in order to enable PTM tracing: 1. Execute the steps described in the previous section to perform Linux kernel debugging. 2. Select Run > Debug Configurations and select the KernelDebug configuration previously created. 3. Go to Connection tab and click the Edit DTSL Options button.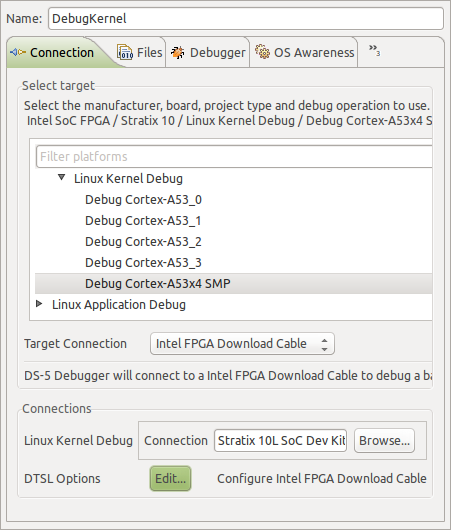 5. In the DTSL dialog, click Trace Buffer tab and select On Chip Trace Buffer* for the Trace capture method.
 6. In the DTSL dialog box, click the Cortex-A53 tab, and enable tracing for all cores.
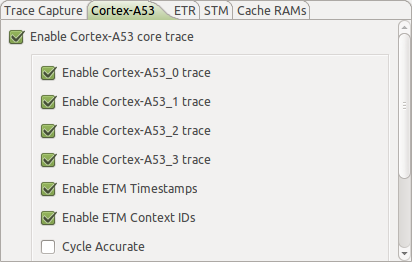 8. Click OK to exit the DTSL Configuration Editor.
9. Start a debugging session by using the DebugKernel debug configuration. The debugger stops the Linux kernel and configures tracing.
10. Let the kernel run by clicking the Continue green button or pressing F8.
11. After executing some commands from the Linux serial terminal, click Interrupt button or press F9. The debugger shows the captured trace information.
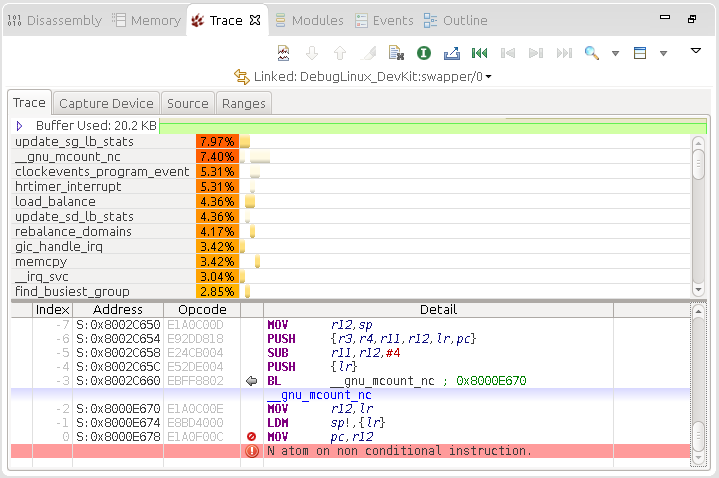 The tracing window shows:
 - Core instructions as they were executed
- Percentage occupied by each function
- Histogram with function allocation
© 1999-2024 RocketBoards.org by the contributing authors. All material on this collaboration platform is the property of the contributing authors.
This website is using cookies. More info.
That's Fine
 RocketBoards